Question 37
What should you use to apply bold text formatting to rows or columns independent of each other?
Correct Answer:B
To apply bold text formatting to rows or columns independently in Tableau, you should use the Rows tab or the Columns tab on the Format Font pane. This approach provides control over the formatting of text within individual rows or columns. By selecting the appropriate tab (Rows or Columns), you can apply formatting settings, including bold text, to only the selected rows or columns. This is a crucial feature for enhancing the readability and visual appeal of specific parts of a Tableau worksheet, allowing for emphasis on particular data points or categories.
Question 38
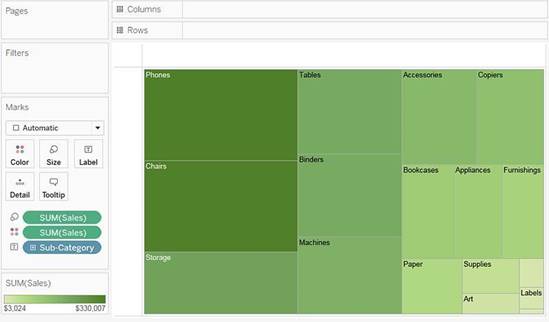
In Tree maps, the size begins with the largest rectangle on the ______ and the smallest rectangle on the ______.
Correct Answer:C
Tree maps size begins from maximum in top left to smallest in bottom right.
See below to learn how to create a TreeMap and add colours to it:
Reference: https://help.tableau.com/current/pro/desktop/en-us/buildexamples_treemap.htm
Question 39
You need to uniformly change the size for all marks in a view. What should you do?
Correct Answer:D
You should select Size on the Marks card and use the slider to adjust the size to uniformly change the size for all marks in a view. The Size property on the Marks card allows you to control the size of marks in the view by moving the slider to the left or right. The Size slider affects different marks in different ways, such as making them bigger or smaller, wider or narrower, or thicker or thinner1 The other options are not valid ways to uniformly change the size for all marks in a view. Selecting Label on the Marks card and then selecting Alignment will allow you to change the position of labels on marks, not the size of marks2 Using the Fit dropdown menu on the toolbar will allow you to change how the view fits within the worksheet, not the size of marks3 Selecting Format on the menu, and then selecting Cell Size will allow you to change the height and width of cells in a text table, not the size of marks in other types of views4
Question 40
You have the following visualization.
You need to show how Internet Usage values change from year-to-year as a percentage. Which quick table calculation should you apply to the Internet Usage field?
Correct Answer:B
To show how Internet Usage values change from year to year as a percentage, you should apply the "Percent Difference" quick table calculation to the Internet Usage field. This calculation compares each value to the previous value and computes the difference as a percentage, which is ideal for analyzing the rate of change over a sequential time period such as consecutive years.
Question 41
Which type of chart can you create without using a dimension?
Correct Answer:B
Bar charts in Tableau do not require a dimension to be created. You can create a bar chart using only a measure; this will produce a single bar that represents the aggregate of the measure values, such as the sum or average of sales.
Question 42
Which aggregation is available without requiring a table calculation or calculated field?
Correct Answer:B
Standard deviation is an aggregation that is available without requiring a table calculation or calculated field. Standard deviation is a statistical measure that shows how much variation there is from the average value in a set of data. Standard deviation is one of the predefined aggregations in Tableau that can be applied to any measure by selecting it from the context menu of the measure or from the drop-down menu on the Marks card6 The other options are not aggregations that are available without requiring a table calculation or calculated field. Running total, sample covariance, and percent of total are all examples of table calculations, which are computations that are applied to the values in an entire table or partition of a table. Table calculations can be created by selecting them from the context menu of a measure or by using functions in a calculated field7