Question 25
True or False: A LEFT JOIN or INNER JOIN creates a row each time the join criteria is satisfied, which can result in duplicate rows. One way to avoid this is to use data blending instead.
Correct Answer:A
Joins combine tables by adding more columns of data across similar row structures. This can cause data loss or duplication if tables are at different levels of detail, and joined data sources must be fixed before analysis can begin.
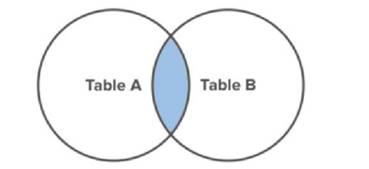
Inner join
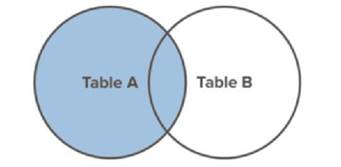
Left Join
Blends, unlike relationships or joins, never truly combine the data. Instead, blends query each data source independently, the results are aggregated to the appropriate level, then the results are presented visually together in the view.
Reference: https://help.tableau.com/current/pro/desktop/en-us/multiple_connections.htm
Question 26
What are three ways to access bolding options for the text in a tooltip? Choose three.
Correct Answer:ACF
To access bolding options for the text in a tooltip in Tableau, you can:
✑ Select Tooltip on the Marks card, which allows you to edit the tooltip for the specific marks.
✑ Select Worksheet on the menu, and then Tooltip, to open the tooltip editor for the worksheet.
✑ Right-click on the Field and select Format, which lets you format the text including bolding options in the tooltip.
Question 27
From which three locations can you sort a visualization? Choose three.
Correct Answer:AEF
According to the Tableau Desktop Specialist Exam Guide, one of the exam objectives is to “Sort data in a visualization”. The guide also states that “You can sort data in a visualization from three locations: the Worksheet menu, an axis, or a field label” (page
15).
Question 28
True or False: A sheet cannot be used within a story directly. Either sheets should be used within a dashboard, or a dashboard should be used within a story.
Correct Answer:B
It is possible in Tableau to use a sheet within a story directly.
Moreover, in Tableau, a story is a sequence of visualizations that work together to convey information. You can create stories to tell a data narrative, provide context, demonstrate how decisions relate to outcomes, or to simply make a compelling case.
At the same time, a story is also a collection of sheets, arranged in a sequence. Each individual sheet in a story is called a story point.

Reference: https://help.tableau.com/current/pro/desktop/en-us/stories.htm
Question 29
Which of the following can you use to create a Histogram?
Correct Answer:B
A histogram is a chart that displays the shape of a distribution. A histogram looks like a bar chart but groups values for a continuous measure into ranges, or bins.
The basic building blocks for a histogram are as follows:

Demo :
Reference: https://help.tableau.com/current/pro/desktop/en- us/buildexamples_histogram.htm
Question 30
Which of the following lets you group related dashboard items together so you can quickly position them?
Correct Answer:C
Layout containers let you group related dashboard items together so you can quickly position them. As you change the size and placement of items inside a container, other container items automatically adjust
Reference: https://help.tableau.com/current/pro/desktop/en- us/dashboards_organize_floatingandtiled.htm