Question 7
Suppose I have the following view. What will be the total number of marks if I drag a new measure to the row shelf vs the column shelf?
Correct Answer:A
This is a tricky question often asked in the exam.
If we drag a new measure to the row shelf, the following happens:
We now have 2 rows, and the same 7 columns for both these rows. Therefore, 2x7 = 14 marks!
But if we drag the same measure to the column shelf, we have just 1 row and a chart created for each of the columns. So (1x7) = 7 marks!
Reference and notes: https://medium.com/@justindixon91/tableau-specialist-exam-notes- part-4-understanding-tableau-concepts-f78de83fdd35
Question 8
Tableau will automatically create a hierarchy for which two kinds of data? Choose two.
Correct Answer:AD
Tableau will automatically create a hierarchy for date and geographic data. A hierarchy is a way of organizing data into different levels of detail. For example, a date hierarchy can have year, quarter, month, and day levels. A geographic hierarchy can have country, state, city, and zip code levels. Tableau recognizes date and geographic data based on their data types and formats, and creates hierarchies for them by default. Tableau does not automatically create hierarchies for date & time or string data3
Question 9
When creating a histogram in Tableau, to what does bin size refer?
Correct Answer:B
When creating a histogram in Tableau, bin size refers to the range of the continuous measure counted in each bin. A histogram is a chart that displays the shape of a distribution of a continuous measure. A histogram looks like a bar chart but groups values for a continuous measure into ranges, or bins. The basic building blocks for a histogram are as follows: Mark type: Automatic; Rows shelf: Continuous measure (aggregated by Count or Count Distinct); Columns shelf: Bin (continuous or discrete)4 To create bins from a continuous measure, you need to specify the size of bins, which determines how many bins are created and how wide they are. The size of bins is equal to the difference between consecutive values along the axis that represents the bins. For example, if you have bins with values 0-10, 10-20, 20-30, etc., then the size of bins is 10. You can either enter a value for the size of bins manually or have Tableau suggest an optimal bin size based on a formula that considers the number of distinct rows and the minimum and maximum values in the data5 The other options are not valid definitions of bin size when creating a histogram in Tableau. The minimum number of axis ticks in the view is determined by Tableau’s automatic scaling and formatting of axes, which can be adjusted manually if needed. The count distinct (COUNTD) of items on either axis is an aggregation function that returns the number of unique values in a field, which can be used as a measure in a histogram but not as bin size. The maximum number of marks in the view is limited by the performance and readability of the visualization, which can be improved by filtering, sorting, or aggregating the data4
Question 10
Which two filter modes can you use with continuous filters? Choose two.
Correct Answer:BC
According to the Tableau Help, there are two filter modes for continuous filters: Range of Values and Single Value. The help also states that “Range of Values lets you specify a minimum and maximum value for the filter using sliders or input fields” and “Single Value lets you select one value on a slider for the filter” (page 1).
Question 11
What statement correctly describes a requirement to create a reference line in Tableau?
Correct Answer:B
In Tableau, to create a reference line, one of the axes in the view must contain an aggregated measure. Reference lines are typically used to add context or additional information to the data in a view, and they are often based on some form of aggregate such as the average, median, sum, etc., of a measure.
Question 12
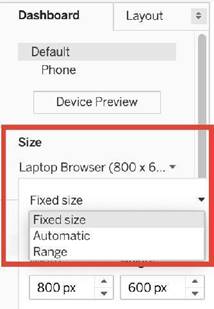
Which of the following are valid Dashboard size options?
Correct Answer:ABC
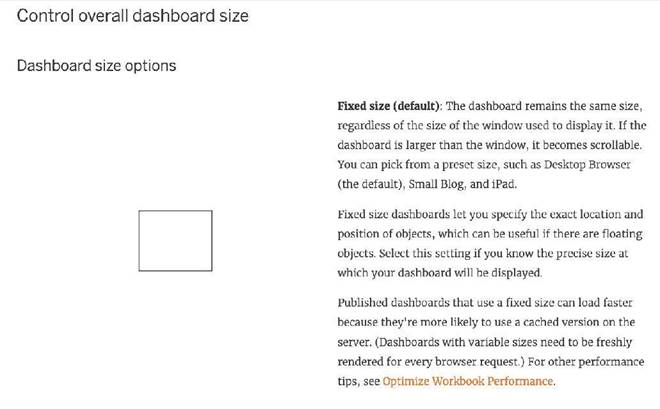
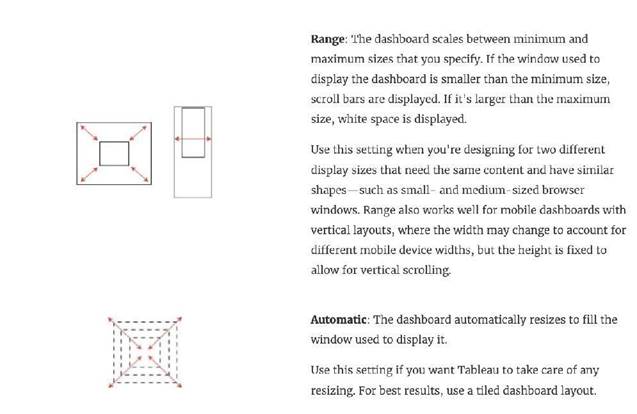
Scaled is NOT a valid size options when creating Dashboards in Tableau!
After you create a dashboard, you might need to resize and reorganize it to work better for your users.


Reference: https://help.tableau.com/current/pro/desktop/en- us/dashboards_organize_floatingandtiled.htm