Question 73
What is the default behavior of Tableau when you add a measure to the view?
Correct Answer:D
The default behavior of Tableau when you add a measure to the view is to automatically apply an aggregation to that measure. The type of aggregation applied can vary depending on the context of the view. For example, if no other measures or dimensions affect the measure, Tableau might default to SUM. However, if there are other dimensions in the view that define the level of detail, the aggregation might be different to reflect the context.
Question 74
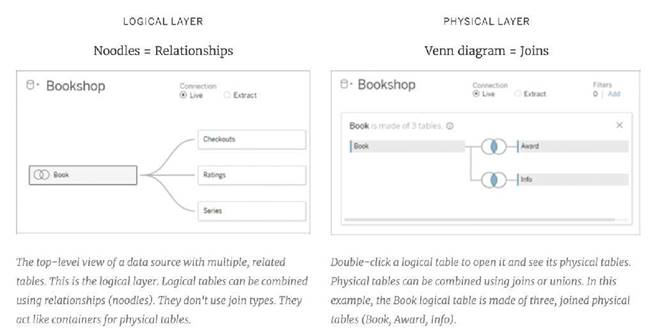
Relationships are represented by _______ and operate at the ________.
Correct Answer:A
From the official documentation:
The default view that you first see in the Data Source page canvas is the logical layer of the data source. You combine data in the logical layer using relationships (or noodles).
Reference: https://help.tableau.com/current/server/en-us/datasource_datamodel.htm
Question 75
You need to display the complete list of potential data connections when you connect to a server. What action should you perform?
Correct Answer:C
To display the complete list of potential data connections when connecting to a server in Tableau, you should select "More" under the "To a Server" option. This action will provide a comprehensive list of server types and data sources that Tableau can connect to.
Question 76
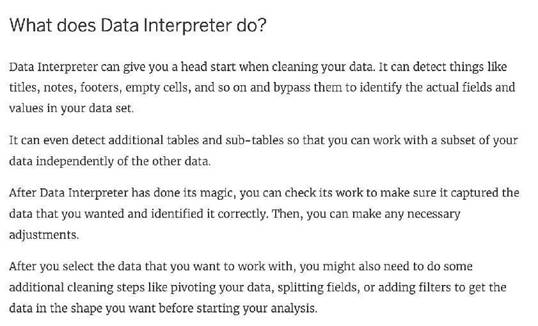
You can use the _____ in Tableau to clean / organise your data.
Correct Answer:C
When you track data in Excel spreadsheets, you create them with the human interface in mind. To make your spreadsheets easy to read, you might include things like titles, stacked headers, notes, maybe empty rows and columns to add white space, and you probably have multiple tabs of data too.
When you want to analyze this data in Tableau, these aesthetically pleasing attributes make it very difficult for Tableau to interpret your data. That’s where Data Interpreter can help.
Reference: https://help.tableau.com/current/pro/desktop/en-us/data_interpreter.htm
Question 77
You have cleaned a data source properly, created some calculated fields and renamed some columns. You want to save these changes for future use cases. Which of the following would BEST satisfy this requirement?
Correct Answer:C
After making changes to Data, we can save that new data source as a .tds file. To do so,
go to data menu on top and then choose your current connected data source. Then next click on Add to Saved Data sources. This will save all calculated fields, changes to fields etc. It will be saved in My Tableau Repository -> Mydatasources. This will then also appear on Tableau Home Page under saved data sources like SampleSuperStore.
Note: Data source files do not contain the actual data but rather the information necessary to connect to the actual data as well as any modifications you've made on top of the actual data such as changing default properties, creating calculated fields, adding groups, and so on.
twb and .twbx are not the BEST solutions since the questions nowhere mentions that we need to store our workbooks as well.
twm is a bookmark which contains a single worksheet and are an easy way to quickly share your work.
Reference: https://help.tableau.com/current/pro/desktop/en-us/environ_filesandfolders.htm
Question 78
Which two elements can have their values changed by using a dashboard action? Choose two.
Correct Answer:CD
In Tableau, the two elements that can have their values changed by using a dashboard action are Sets and Parameters. Dashboard actions can be configured to modify the values within a set or a parameter, allowing for interactive and dynamic changes in the visualization based on user interactions. For example, selecting a specific data point in a dashboard can trigger an action that updates a set or changes the value of a parameter, which in turn can alter the displayed data or the appearance of visualizations within the dashboard.