Question 67
What is created by a calculated field that has a formula of SUM(Sales)/SUM(Profit)?
Correct Answer:B
a calculated field that has a formula of SUM(Sales)/SUM(Profit) is a measure, because it returns a numeric value that can be aggregated and used for analysis. A parameter is a user-defined variable that can be used in calculations or filters. A dimension is a categorical field that can be used to group or slice data. A set is a subset of data based on some condition.
Question 68
True or False: It is possible to change the Geographic Role of a dimension
Correct Answer:A
A geographic role associates each value in a field with a latitude and longitude value. Assigning a geographic role based on the type of location (such as state versus postcode) helps ensure that your data is plotted correctly on your map view. For example, you can assign the City geographic role to a field that contains a list of city names.
To assign a geographic role to a field:
In the Data pane, click the data type icon next to the field, select Geographic Role, and then select the geographic role you want to assign to the field.
When you assign a geographic role to a field, Tableau adds two fields to the Measures area of the Data pane: Latitude (generated) and Longitude (generated).
These fields contain latitude and longitude values and are assigned the Latitude and Longitude geographic roles. If you double-click each of these fields, Tableau adds them to the Columns and Rows shelves and creates a map view using the Tableau background map.
Reference: https://help.tableau.com/current/pro/desktop/en-us/maps_geographicroles.htm
Question 69
Which of the following is NOT a new feature introduced in Tableau 2020.1?
Correct Answer:D
Your Tableau Desktop Specialist exam will be based on the 2020.1 version.
Set controls are a new feature introduced in the 2020.2 version, and hence is the correct answer - it is not a part of 2020.1
For the 2020.1 version the new features were:
1) Viz animations:
Viz animations help you see and understand your changing data. It’s easy to track the logical steps behind data’s evolution and tell powerful data stories. Sorting, filtering, adding fields, and other actions will now smoothly animate your visualizations. Choose whether to turn Viz Animations on or off, and decide how you’d best like to apply animations to your new workbooks.
2) Dynamic Parameters:
Say goodbye to republishing workbooks with parameters every time the underlying data changes. Set your parameter once, and Tableau will automatically update the parameter’s list of values every time someone opens the workbook.
3) Buffer Calculations:
Buffer calculations allow you to visualize the distance around point locations. Give Tableau three parameters—location, distance, and a unit of measure—and a buffer, or boundary is instantly created. Answering complex spatial questions becomes easier than ever before—visualize what properties are within 200 meters of a proposed transit site, or how many competitors’ stores are within 1 mile of their store, and more.
Question 70
What does the box in a box plot represent?
Correct Answer:C
In a box and whisker plot:
1) The ends of the box are the upper and lower quartiles, so the box spans the interquartile range
2) The median is marked by a vertical line inside the box
3) The whiskers are the two lines outside the box that extend to the highest and lowest observations.
Question 71
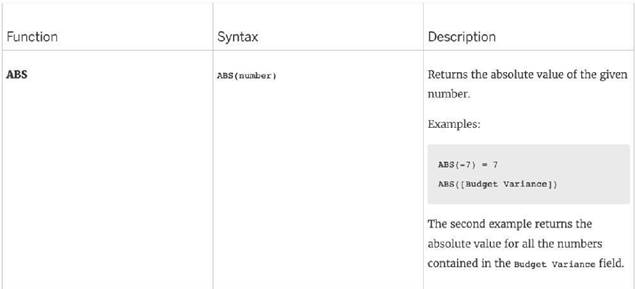
Which of the following returns the Absolute Value of a given number?
Correct Answer:A
From the official Tableau website:


Reference: https://help.tableau.com/current/pro/desktop/en- us/functions_functions_number.htm
Question 72
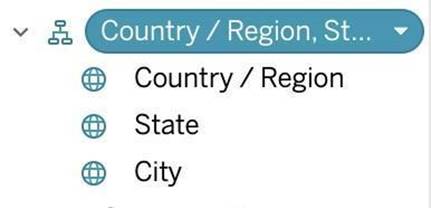
What term is used to describe the following picture?
Correct Answer:C
When you connect to a data source, Tableau automatically separates date fields into hierarchies so you can easily break down the viz. You can also create your own custom hierarchies. For example, if you have a set of fields named Region, State, and County, you can create a hierarchy from these fields so that you can quickly drill down between levels in the viz.
Reference: https://help.tableau.com/current/pro/desktop/en-us/qs_hierarchies.htm