Question 61
If you are working with a huge dataset, which of the following are strong reasons to use a context filter?
Correct Answer:AD
By default, all filters that you set in Tableau are computed independently. That is, each filter accesses all rows in your data source without regard to other filters. However, you can set one or more categorical filters as context filters for the view. You can think of a context filter as being an independent filter (Option stating - To create a dependent filter eliminated
here). Any other filters that you set are defined as dependent filters because they process only the data that passes through the context filter.
You may create a context filter to:
1) Improve performance – If you set a lot of filters or have a large data source, the queries can be slow. You can set one or more context filters to improve performance.
2) Create a dependent numerical or top N filter – You can set a context filter to include only the data of interest, and then set a numerical or a top N filter.
For example, suppose you’re in charge of breakfast products for a large grocery chain.
Your task is to find the top 10 breakfast products by profitability for all stores. If the data source is very large, you can set a context filter to include only breakfast products. Then you can create a top 10 filter by profit as a dependent filter, which would process only the data that passes through the context filter.
Reference: https://help.tableau.com/current/pro/desktop/en-us/filtering_context.htm
Question 62
When using a data source that has relationships, how can you add a join between two or more tables?
Correct Answer:C
When using a data source that has relationships, you can add a join between two or more tables by dragging a table directly on top of an existing logical table from the Tables pane. This will create a logical table that contains the joined tables. You can then edit the join type, join clauses, and join calculation as needed2 The other options are not valid ways to add a join between tables when using relationships. From the Tables pane, double-clicking a table will add it to the data source as a separate logical table, not joined with any other table. From the Connections pane, selecting Add will allow you to add
another connection to the data source, not join tables within the same connection. Double- clicking a logical table in the canvas will open the Data Source page, where you can view and edit the fields in the logical table, not join it with another table2
Question 63
Which type of filter affects a fixed Level of Detail (LOD) expression?
Correct Answer:C
In Tableau, a Fixed Level of Detail (LOD) expression calculates values at a specific level of granularity, regardless of the dimensions in the view. The computation of a fixed LOD expression can be influenced by a context filter. A context filter serves as a primary filter, setting the context for the rest of the filters in the view. When a context filter is applied, it effectively changes the level at which the fixed LOD expression is computed, thereby affecting its outcome. Other types of filters, such as table calculation, measure, and dimension filters, do not have this influence on fixed LOD expressions.
Question 64
By definition, Tableau displays measures over time as a ______
Correct Answer:D
Line charts connect individual data points in a view. They provide a simple way to visualize a sequence of values and are useful when you want to see trends over time, or to forecast future values.
Please refer to the images below:

Reference: https://help.tableau.com/current/pro/desktop/en-us/buildexamples_line.htm
Question 65
What is a Tableau story point?
Correct Answer:C
A Tableau story point is an individual container in a story that holds a sheet or dashboard. It's like a slide in a presentation, and a story is a sequence of these points that can be used to convey a data narrative, showing how facts are connected and guiding the audience through a sequence of analysis steps.
Question 66
DOWNLOAD THE DATASET FROM:
https://drive.google.com/drive/folders/1WXzqsrNmXVdmQ- 574wld4InEplyKT8RP?usp=sharing (if you haven't already)
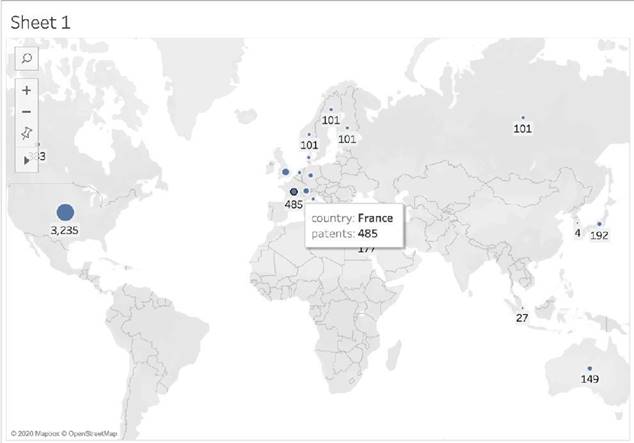
Using the cwurData table, plot a Map to see which country had the Second highest number of patents in the Year 2013?
Correct Answer:B
Follow along to get the correct Answer
✑ Drag Country to the view, and then Patents to the Size Mark on the Marks shelf as follows :
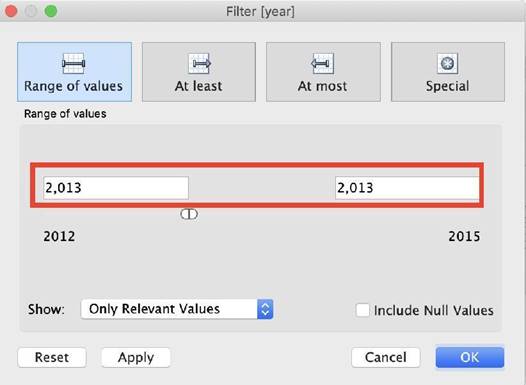
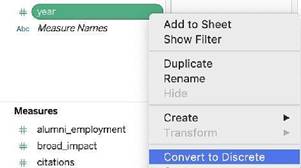
2) But, this isn't all right? We need to focus on the year 2013. This can be done by using the year column as it is (continuous) in the filter shelf, or by converting it to discrete first and then using it:
* 2.1 As it is (continuous)
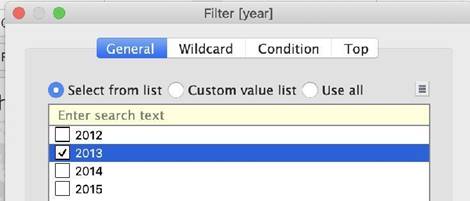
* 2.2 Converting to discrete first & then using it
and then :
3) We can now see that France, with 485 has the 2nd most number of patents for the year 2013