Online TDS-C01 Practice TestMore Tableau Products >
Free Tableau TDS-C01 Exam Dumps Questions
Tableau TDS-C01: Tableau Desktop Specialist
- Get instant access to TDS-C01 practice exam questions
- Get ready to pass the Tableau Desktop Specialist exam right now using our Tableau TDS-C01 exam package, which includes Tableau TDS-C01 practice test plus an Tableau TDS-C01 Exam Simulator.
- The best online TDS-C01 exam study material and preparation tool is here.
Question 1
Which Sub-Category had the least Profit in the Office Supplies category?
Correct Answer:A
To reach the correct answer, follow the steps below:
1) Drag Category, and sub-category to the row shelf. Drag Profit to the Column shelf
2) Click the Sort-ascending icon as shown above, to sort the profits from least to greatest as shown:
Click the 'Show mark labels icon'
As we can see, Fasteners has the least Profit in the Office Supplies Category, and hence is our correct answer!
Question 2
Which statement accurately describes an extract when the Physical Tables option is selected?
Correct Answer:C
When the Physical Tables option is selected for an extract in Tableau, an individual table is created for each physical table in the extract. This means that the extract will include a separate table for each underlying table in your database, maintaining the database's structure within the extract. This can be useful when you need to preserve the original granularity of the data or when working with certain database optimizations.
Question 3
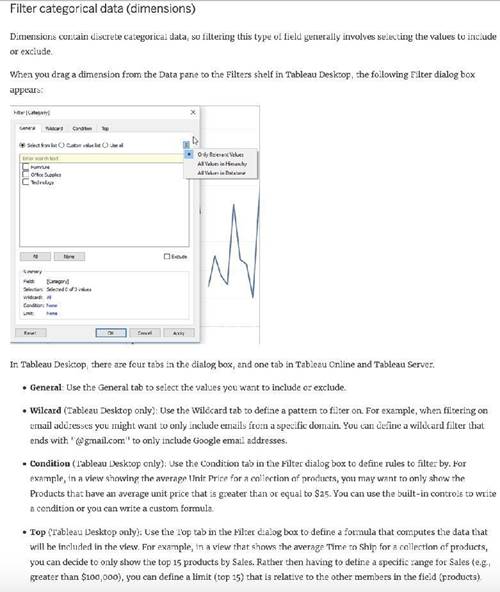
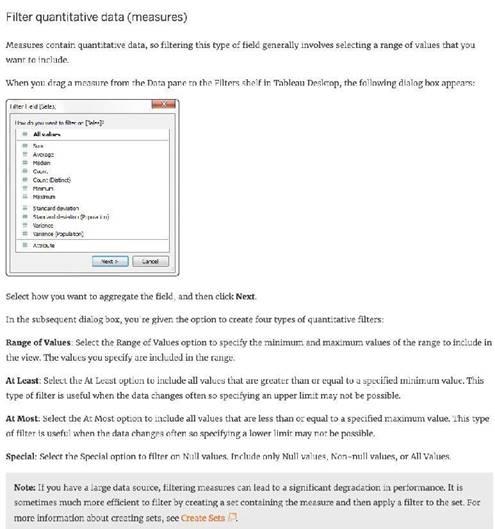
True or False: You get different filtering options for categorical and quantitative data
Correct Answer:A
Yes! We get different options for filtering depending on whether we use a categorical data (think dimension) or quantitative data (think measure).
Important Note: Each tab adds additional definitions to your filter. For example, you can select to exclude values under the General tab, and also add limits under the Top tab. Selections and configurations from both tabs are applied to your filter.At any time, you can see the definitions of your filter under Summary on the General tab.
Note: If you have a large data source, filtering measures can lead to a significant degradation in performance. It is sometimes much more efficient to filter by creating a set containing the measure and then apply a filter to the set. For more information about creating sets, see Create Sets
Reference: https://help.tableau.com/current/pro/desktop/en-us/filtering.htm
Question 4
Is it possible to deploy a URL action on a dashboard object to open a Web Page within a dashboard rather than opening the system’s web browser?
Correct Answer:C
To interactively display information from the web INSIDE a dashboard, you can use a URL action with a web page object.
For example, you might have a dashboard that shows profits by country. In addition to showing the profit data in your dashboard, you also want to display supplemental information about the countries from a web site.


Reference: https://help.tableau.com/current/pro/desktop/en-us/actions_dashboards.htm
Question 5
The calculation [Ship Date] - [Order Date] will return _______
Correct Answer:B
As the names suggest, if we subtract the order date from the shipping date, we simply get the number of days between these 2 dates.
We can these use this calculated field in our charts, and can use COUNT, SUM, AVG etc with them according to our need.
Question 6
Dates in Tableau are typically treated as ______
Correct Answer:A
For relational data sources, dates and times are automatically placed in the Dimensions area of the Data pane and are identified by the date or date-time icon. For example, the Order Date and Ship Date dimensions from an Excel data source are shown below:
When you place a relational date on a shelf, the field name is automatically modified to reflect the default date level. Tableau defines the default date level to be the level at which there are multiple instances. For example, if the date field includes multiple years, the default level is year. However, if the date field contains data for just one year but includes multiple months, then the default level is month.
Reference: https://help.tableau.com/current/pro/desktop/en-us/dates.htm