Question 25
- (Exam Topic 4)
You have a report that contains four pages. Each page contains slicers for the same four fields. Users report that when they select values on a slicer on one page, the visuals are not updated on all the pages. You need to
recommend a solution to ensure that users can select a value once to filter the results on all the pages. What are two possible recommendations to achieve this goal? Each correct answer presents a complete solution. NOTE: Each correct selection is worth one point.
Correct Answer:AE
Add a report-level filter to filter an entire report.
The visuals on the active page, and on all pages in the report, change to reflect the new filter. You can sync a slicer and use it on any or all pages in a report.
* 1. On the Power BI Desktop View menu, select Sync slicers.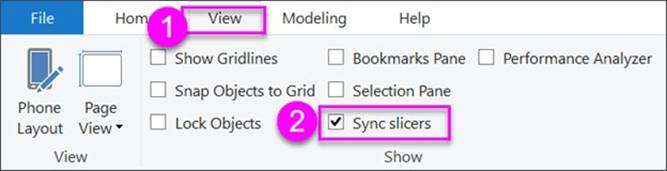
The Sync slicers pane appears between the Filters and Visualizations panes.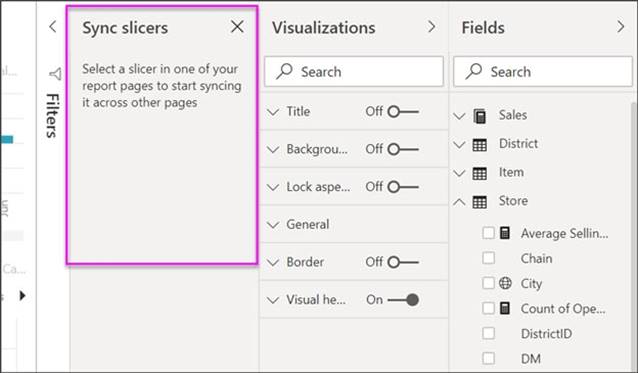
Reference:
https://docs.microsoft.com/en-us/power-bi/create-reports/power-bi-report-add-filter https://docs.microsoft.com/en-us/power-bi/visuals/power-bi-visualization-slicers
Question 26
- (Exam Topic 4)
You open a query in Power Query Editor.
You need to identify the percentage of empty values in each column as quickly as possible. Which Data Preview option should you select?
Correct Answer:D
Column quality: In this section, we can easily see valid, Error and Empty percentage of data values associated with the Selected table.
Note: In Power Query Editor, Under View tab in Data Preview Section we can see the following data profiling functionalities: Column quality Column distribution Column profile
Reference:
https://community.powerbi.com/t5/Community-Blog/Data-Profiling-in-Power-BI-Power-BI-Update-April-2019/
Question 27
- (Exam Topic 4)
You have a sales system that contains the tables shown in the following table.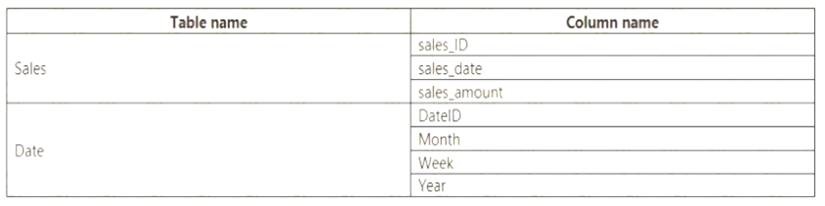
The Date table is marked as a date table.
DatelD is the date data type. You need to create an annual sales growth percentage measure. Which DAX expression should you use?
Correct Answer:B
SAMEPERIODLASTYEAR returns a table that contains a column of dates shifted one year back in time from the dates in the specified dates column, in the current context.
Reference:
https://docs.microsoft.com/en-us/dax/sameperiodlastyear-function-dax
Question 28
- (Exam Topic 4)
Note: This question is part of a series of questions that present the same scenario. Each question in the series contains a unique solution that might meet the stated goals. Some question sets might have more than one correct solution, while others might not have a correct solution.
After you answer a question in this section, you will NOT be able to return to it. As a result, these questions will not appear in the review screen.
You have a Microsoft Excel workbook that is saved to Microsoft SharePoint Online. The workbook contains several Power View sheets.
You need to recreate the Power View sheets as reports in the Power Bl service.
Solution: From the Power Bl service, get the data from SharePoint Online, and then click Connect Does this meet the goal?
Correct Answer:B
We need to click "Import", not "Connect". References:
https://docs.microsoft.com/en-us/power-bi/service-excel-workbook-files
Question 29
- (Exam Topic 4)
You have the visual shown in the exhibit. (Click the Exhibit tab.)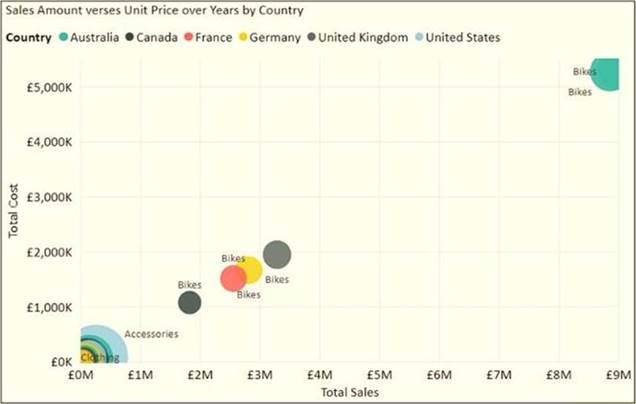
You need to show the relationship between Total Cost and Total Sales over time. What should you do?
Correct Answer:A
You can set up a date field in play axis, and then scatter chart will animate how measure values are compared to each other in each point of a time.
Reference:
https://radacad.com/storytelling-with-power-bi-scatter-chart
Question 30
- (Exam Topic 4)
You have a Power BI model that has the following tables:  Product (Product_id, Product_Name)
 Sales (Order_id, Order_Date, Product_id, Salesperson_id, Sales_Amount) Salesperson (Salesperson_id, Salesperson_name, address)
You plan to create the following measure. Measure1 = DISTINCTCOUNT(Sales[ProductID]) You need to create the following relationships: Sales to Product Sales to Salesperson
The solution must ensure that you can use Measure1 to display the count of products sold by each salesperson.
How should you configure the relationships? To answer, select the appropriate options in the answer area.
NOTE: Each correct selection is worth one point.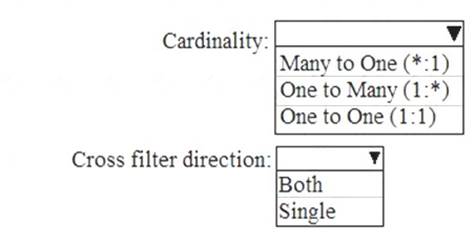
Solution:
Graphical user interface, text Description automatically generated
Does this meet the goal?
Correct Answer:A