Online PL-300 Practice TestMore Microsoft Products >
Free Microsoft PL-300 Exam Dumps Questions
Microsoft PL-300: Microsoft Power BI Data Analyst
- Get instant access to PL-300 practice exam questions
- Get ready to pass the Microsoft Power BI Data Analyst exam right now using our Microsoft PL-300 exam package, which includes Microsoft PL-300 practice test plus an Microsoft PL-300 Exam Simulator.
- The best online PL-300 exam study material and preparation tool is here.
Question 1
- (Exam Topic 3)
You need to create a solution to meet the notification requirements of the warehouse shipping department. What should you do? To answer, select the appropriate options in the answer area.
NOTE: Each correct select is worth one point: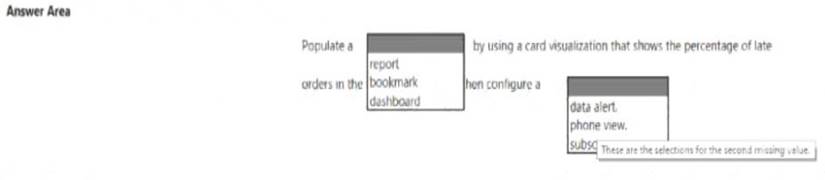
Solution: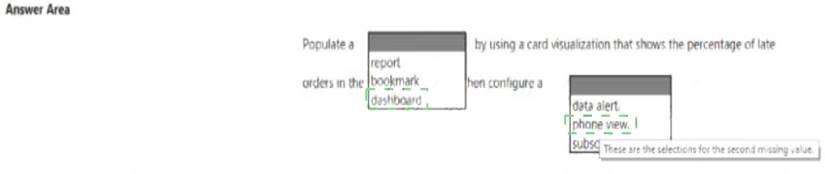
Does this meet the goal?
Correct Answer:A
Question 2
- (Exam Topic 2)
Once the profit and loss dataset is created, which four actions should you perform in sequence to ensure that the business unit analysts see the appropriate profit and loss data? To answer, move the appropriate actions from the list of actions to the answer area and arrange them in the correct order.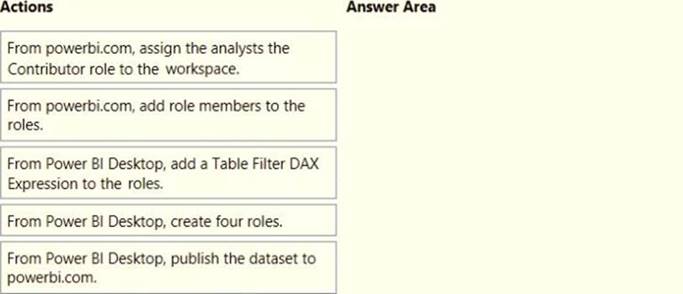
Solution: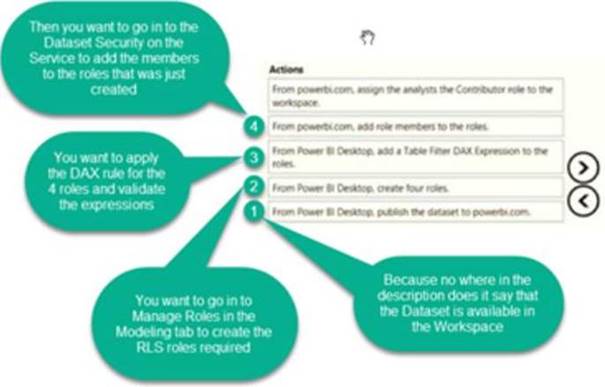
https://docs.microsoft.com/en-us/power-bi/admin/service-admin-rls https://docs.microsoft.com/en-us/power-bi/connect-data/service-datasets-build-permissions
Does this meet the goal?
Correct Answer:A
Question 3
- (Exam Topic 4)
Correct Answer:A - (Exam Topic 2)
Correct Answer:A - (Exam Topic 4)
Correct Answer:D - (Exam Topic 4)
Correct Answer:A
Your company has affiliates who help the company acquire customers.
You build a report for the affiliate managers at the company to assist them in understanding affiliate performance.
The managers request a visual showing the total sales value of the latest 50 transactions for each affiliate. You have a data model that contains the following tables.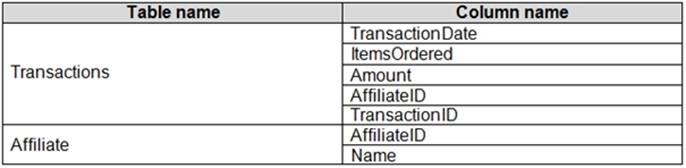
You need to develop a measure to support the visual.
How should you complete the DAX expression? To answer, select the appropriate options in the answer area. NOTE: Each correct selection is worth one point.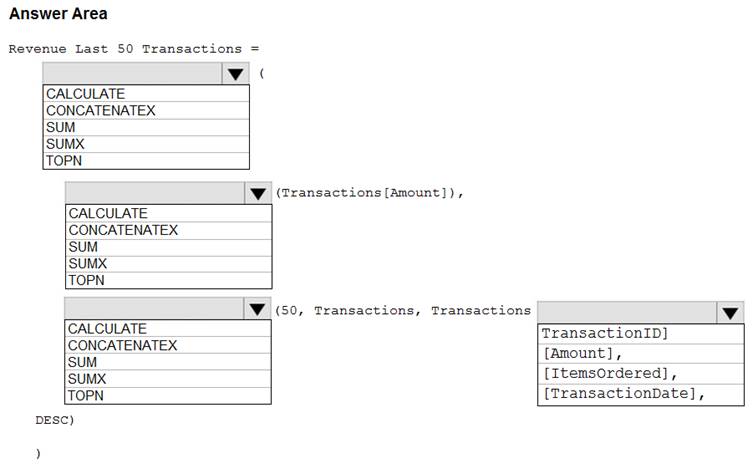
Solution:
Box 1: CALCULATE
Start with CALCULATE and use a SUMX.
CALCULATE evaluates an expression in a modified filter context. Box 2: SUM
Box 3: TOPN
TOPN returns the top N rows of the specified table. Box 4: [TransactionDate]
TOPN Syntax: TOPN(,
The orderBy_expression: Any DAX expression where the result value is used to sort the table and it is evaluated for each row of table.
Reference:
https://docs.microsoft.com/en-us/dax/topn-function-dax
Does this meet the goal?
Question 4
You need to create a DAX measure in the data model that only allows users to see projections at the appropriate levels of granularity.
How should you complete the measure? To answer, drag the appropriate values to the correct targets. Each value may be used once, more than once, or not at all. You may need to drag the split bar between panes or scroll to view content.
NOTE: Each correct selection is worth one point.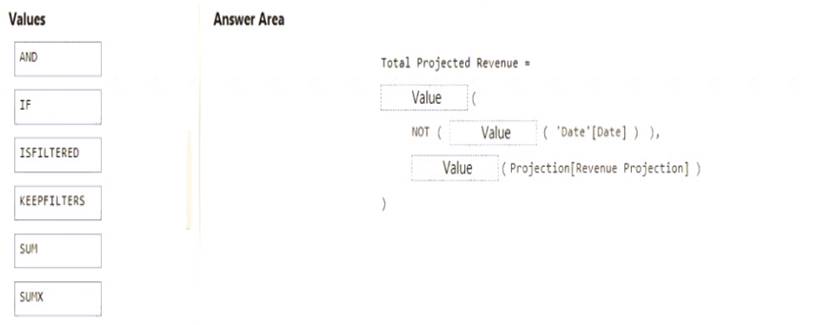
Solution:
Scenario: Revenue projections are set at the monthly level and summed to show projections for the quarter. Box 1: IF
Box 2: ISFILTERED
ISFILTERED returns TRUE when columnName is being filtered directly. If there is no filter on the column or if the filtering happens because a different column in the same table or in a related table is being filtered then the function returns FALSE.
Box 3: SUM
Reference:
https://docs.microsoft.com/en-us/dax/isfiltered-function-dax
Does this meet the goal?
Question 5
You have a Power BI dashboard that monitors the quality of manufacturing processes. The dashboard contains the following elements: A line chart that shows the number of defective products manufactured by day.
 A KPI visual that shows the current daily percentage of defective products manufactured. You need to be notified when the daily percentage of defective products manufactured exceeds 3%. What should you create?
Question 6
You have a dataset named Pens that contains the following columns: Unit Price Quantity Ordered
You need to create a visualization that shows the relationship between Unit Price and Quantity Ordered. The solution must highlight orders that have a similar unit price and ordered quantity.
Which type of visualization and which feature should you use? To answer, select the appropriate options in the answer area.
NOTE: Each correct selection is worth one point.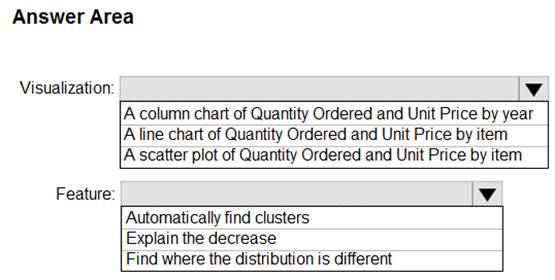
Solution:
Box 1: A scatter plot...
A scatter chart always has two value axes to show: one set of numerical data along a horizontal axis and another set of numerical values along a vertical axis. The chart displays points at the intersection of an x and y numerical value, combining these values into single data points. Power BI may distribute these data points evenly or unevenly across the horizontal axis. It depends on the data the chart represents.
Box 2: Automatically find clusters
Scatter charts are a great choice to show patterns in large sets of data, for example by showing linear or non-linear trends, clusters, and outliers.
Reference:
https://docs.microsoft.com/en-us/power-bi/visuals/power-bi-visualization-scatter
Does this meet the goal?