Question 49
A data analyst is attempting to understand how ice cream consumption is affected by different attributes. such as cost, temperature. and income level. Which of the following regression analyses should the data analyst perform to understand this relationship?
Correct Answer:B
Answer: B. Ordinary least squares
Ordinary least squares (OLS) is a type of linear regression that is used to fit a regression model that describes the relationship between one or more predictor variables and a numeric response variable. Use when: The relationship between the predictor variable(s) and the response variable is reasonably linear. The response variable is a continuous numeric variable1.
In this case, the data analyst is interested in understanding how ice cream consumption (the response variable) is affected by different attributes, such as cost, temperature, and income level (the predictor variables). Assuming that these variables have a linear relationship, OLS can be used to estimate the coefficients of the regression equation that best fits the data. OLS can also provide measures of goodness-of-fit, such as R-squared and adjusted R-squared, and test the significance of the coefficients using t-tests and F- tests2.
Option A is incorrect, as logistic regression is used to fit a regression model that describes the relationship between one or more predictor variables and a binary response variable. Use when: The response variable is binary – it can only take on two values1. Ice cream consumption is not a binary variable, but rather a continuous numeric variable.
Option C is incorrect, as Cox regression is used to fit a regression model that describes the relationship between one or more predictor variables and a survival time response variable. Use when: The response variable is the time until an event of interest occurs, such as death, failure, or recovery3. Ice cream consumption is not a survival time variable, but rather a continuous numeric variable.
Option D is incorrect, as polynomial regression is used to fit a regression model that describes the relationship between one or more predictor variables and a numeric response variable. Use when: The relationship between the predictor variable(s) and the response variable is non-linear1. If there is no evidence of non-linearity in the data, polynomial regression may not be appropriate, as it may overfit the data and produce unreliable estimates.
Question 50
Which of the following query statements would be used when filtering data in a relational database management system? (Select two).
Correct Answer:BC
Question 51
A data analyst needs to calculate the mean for Q1 sales using the data set below: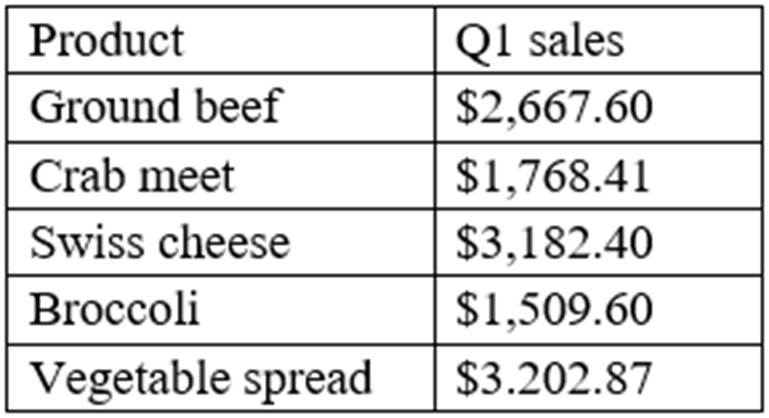
Which of the following is the mean?
Correct Answer:C
The mean is the average of all the values in a data set. To calculate the mean, we add up all the values and divide by the number of values. In this case, the mean for Q1 sales is ($2,000 + $3,000 + $4,000 + $2,500 + $3,500) / 5 = $3,082.72 References: CompTIA Data+ Certification Exam Objectives, page 9
Question 52
Which of the following is an example of PII?
Correct Answer:B
A name is an example of personally identifiable information (PII), which is any data that can be used to identify someone, either on its own or with other relevant data. A name is a direct identifier, which means that it can uniquely identify a person without the need for any additional information. For example, a full name, such as John Smith, can be used to distinguish or trace an individual??s identity1. Other examples of direct identifiers include:
✑ Social Security Number
✑ Passport number
✑ Driver??s license number
✑ Email address
✑ Phone number
Question 53
A customer list from a financial services company is shown below: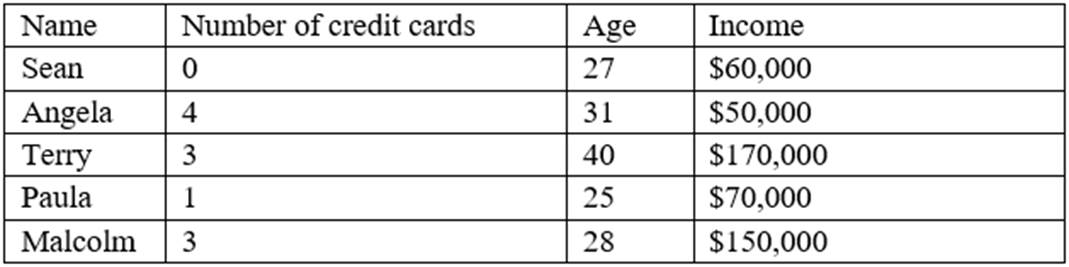
A data analyst wants to create a likely-to-buy score on a scale from 0 to 100, based on an average of the three numerical variables: number of credit cards, age, and income. Which of the following should the analyst do to the variables to ensure they all have the same weight in the score calculation?
Correct Answer:D
Normalizing the variables means scaling them to a common range, such as 0 to 1 or -1 to 1, so that they have the same weight in the score calculation. Recoding the variables means changing their values or categories, which would alter their meaning and distribution. Calculating the percentiles of the variables means ranking them relative to each other, which would not account for their actual magnitudes. Calculating the standard deviations of the variables means measuring their variability, which would not make them comparable. References: CompTIA Data+ Certification Exam Objectives, page 10
Question 54
A development company is constructing a new unit in its apartment complex. The complex has the following floor plans: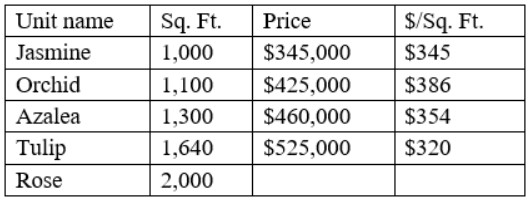
Using the average cost per square foot of the original floor plans, which of the following should be the price of the Rose unit?
Correct Answer:C
This is because the price of the Rose unit can be estimated using the average cost per square foot of the original floor plans, which are Jasmine, Orchid, Azalea, and Tulip. To find the average cost per square foot of the original floor plans, we can use
the following formula:
Plugging in the values from the original floor plans, we get: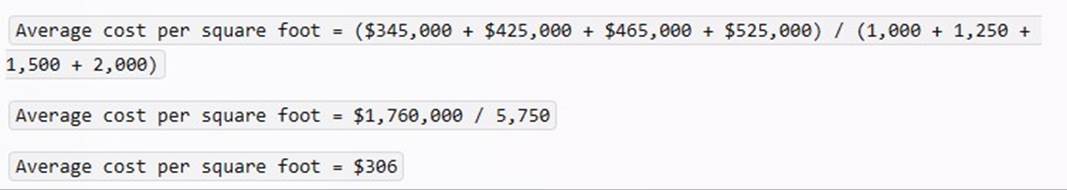
To find the price of the Rose unit, we can use the following formula:
Plugging in the values from the Rose unit, we get:
Therefore, the price of the Rose unit should be $705,200, using the average cost per square foot of the original floor plans.