Question 13
Given the following data table: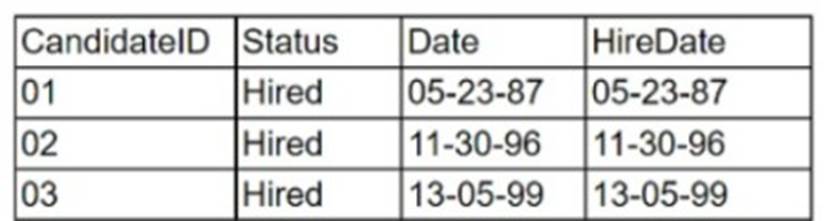
Which of the following are appropriate reasons to undertake data cleansing? (Select two).
Correct Answer:BD
Data cleansing is a critical process in data analytics to ensure the accuracy and quality of data. The reasons to undertake data cleansing include:
✑ Missing Data (B): Missing data can lead to incomplete analysis and biased
results. It is essential to identify and address gaps in the dataset to maintain the integrity of the analysis1.
✑ Invalid Data (D): Invalid data includes entries that are out of range, improperly
formatted, or illogical (e.g., a negative age). Such data can corrupt analysis and
lead to incorrect conclusions1.
Other options, such as non-parametric data (A), are not inherently errors but refer to a type of data that doesn??t assume a normal distribution. Duplicate data © and redundant data (E) could also be reasons for data cleansing, but they are not listed as options to select from in the provided image details. Normalized data (F) refers to data that has been processed to fit into a certain range or format and is typically not a reason for data cleansing. References:
✑ Understanding the importance of data quality and the impacts of missing and
invalid data on research outcomes1.
✑ Best practices in data cleansing2.
Data cleansing is required for various reasons, two of which are missing data (B) and invalid data (D). From the table provided, we can infer the necessity of cleansing in the context of ensuring data integrity and consistency. Missing data refers to the absence of data where it is expected, which can hinder analysis due to incomplete information. Invalid data refers to data that is incorrect, out of range, or in an inappropriate format, which can lead to inaccuracies in any analysis or report. Both these issues can significantly affect the outcomes of any data-related operations and thus need to be rectified through the data cleansing process.
Question 14
A customer survey reveals 90% positive feedback. Which of the following statistical methods would be best to utilize to determine the reliability of a data set and predict how a larger sample of customers over the same time period might respond?
Correct Answer:C
A low standard deviation in survey responses indicates that the data points tend to be close to the mean, suggesting a high level of consistency among the responses. This consistency is crucial for determining the reliability of the data set and predicting future outcomes. If the standard deviation is low, it means that the positive feedback is not only high but also consistent, making it a reliable indicator of customer satisfaction and a good predictor of how a larger sample might respond.
References: The concept of using standard deviation to assess data reliability is a standard practice in statistics and data analysis123.
Question 15
While reviewing survey data, a research analyst notices data is missing from all the responses to a single question. Which of the following methods would BEST address this issue?
Correct Answer:A
This is because missing data is a type of data quality issue that occurs when data is absent or incomplete in a data set, which can affect the accuracy and reliability of the analysis or process. Missing data can be caused by various factors, such as human error, system error, or non-response. Missing data can be addressed by using various methods, such as replacing missing data, which means filling in or imputing the missing values with some reasonable estimates, such as mean, median, mode, or regression. The other methods are not used to address missing data. Here is why:
✑ Remove duplicate data is a type of method that eliminates or reduces duplicate data, which is a type of data quality issue that occurs when data is repeated or copied in a data set. Removing duplicate data does not address missing data, but rather affects the quantity and validity of the data.
✑ Replace redundant data is a type of method that eliminates or reduces redundant data, which is a type of data quality issue that occurs when data is unnecessary or irrelevant for the analysis or purpose. Replacing redundant data does not address missing data, but rather affects the efficiency and performance of the analysis or process.
✑ Remove invalid data is a type of method that eliminates or reduces invalid data, which is a type of data quality issue that occurs when data is incorrect or inaccurate in a data set. Removing invalid data does not address missing data, but rather affects the validity and reliability of the analysis or process.
Question 16
A Chief Executive Officer (CEO) is requesting more up-to-date sales data for improved visibility prior to month-end. An analyst must determine the frequency of a sales report that was previously distributed on an as-needed basis. Which of the following would be the most appropriate frequency for this report?
Correct Answer:C
The most appropriate frequency for the sales report is weekly, as this will provide the CEO with more up-to-date sales data for improved visibility prior to month-end. A weekly sales report can show the sales performance, trends, and issues of the sales team on a regular basis, and help the CEO to monitor and evaluate the progress and results of the sales activities. A weekly sales report can also help the CEO to identify and address any problems or opportunities that may arise during the month, and to make timely and informed decisions.
Question 17
An analyst needs to provide a chart to identify the composition between the categories of the survey response data set: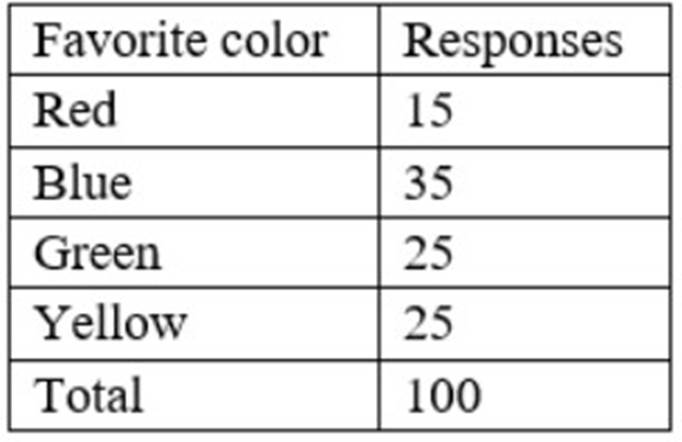
Which of the following charts would be BEST to use?
Correct Answer:B
A pie chart is the best choice to show the composition between the categories of the survey response data set. A pie chart represents the whole with a circle, divided by slices into parts. Each slice shows the relative size of each category as a percentage of the total. A pie chart is useful when the categories are mutually exclusive and add up to 100%. The table shows the favorite color and the number of responses for each color, which can be easily converted into percentages. A pie chart can show how each color contributes to the total number of responses.
Option A is incorrect because a histogram is used to show how data points are distributed along a numerical scale. The survey response data set is not numerical, but categorical. Option C is incorrect because a line chart is used to show trends or changes over time. The survey response data set does not have a time dimension.
Option D is incorrect because a scatter plot is used to show the relationship between two numerical variables. The survey response data set does not have two numerical variables. Option E is incorrect because a waterfall chart is used to show how an initial value is increased or decreased by a series of intermediate values. The survey response data set does not have an initial value or intermediate values.
References:
✑ How to Choose the Right Chart for Your Data - Infogram
✑ How to Choose the Right Data Visualization | Tutorial by Chartio
✑ Find the Best Visualizations for Your Metrics - The Data School
✑ How to choose the best chart or graph for your data
Question 18
Which of the following actions should be taken when transmitting data to mitigate the chance of a data leak occurring? (Choose two.)
Correct Answer:DE
Data encryption and data masking are two actions that can be taken when transmitting data to mitigate the chance of a data leak occurring. Data encryption means transforming data into an unreadable format that can only be decrypted with a key. Data masking means hiding or replacing sensitive data with fictitious or anonymized data. Both methods protect the confidentiality and integrity of the data in transit. References: CompTIA Data+ Certification Exam Objectives, page 13