Question 37
- (Exam Topic 2)
Which DAX expression should you use to get the ending balances in the balance sheet reports?
Correct Answer:A
Scenario: At least one of the balance sheet reports in the quarterly reporting package must show the ending balances for the quarter, as well as for the previous quarter.
DATESQTD returns a table that contains a column of the dates for the quarter to date, in the current context. Reference:
https://docs.microsoft.com/en-us/dax/datesqtd-function-dax
Question 38
- (Exam Topic 4)
You need to create a visualization that compares revenue and cost over time. Which type of visualization should you use?
Correct Answer:C
A line chart or line graph displays the evolution of one or several numeric variables. Data points are connected by straight line segments. A line chart is often used to visualize a trend in data over intervals of time – a time series – thus the line is often drawn chronologically.
Example: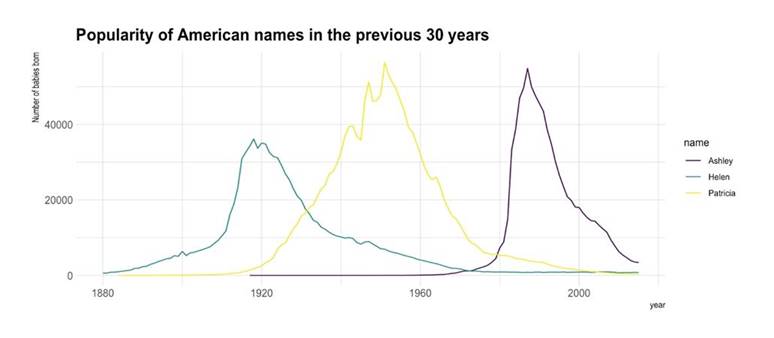
Reference:
https://www.data-to-viz.com/graph/line.html
Question 39
- (Exam Topic 4)
You have a Microsoft Power BI data model that contains three tables named Orders, Date, and City. There is a one-to-many relationship between Date and Orders and between City and Orders.
The model contains two row-level security (RLS) roles named Role1 and Role2. Role1 contains the following filter.
City[State Province] = "Kentucky" Role2 contains the following filter. Date[Calendar Year] = 2020
If a user is a member of both Role1 and Role2, what data will they see in a report that uses the model?
Correct Answer:B
When a report user is assigned to multiple roles, RLS filters become additive. It means report users can see table rows that represent the union of those filters.
Reference:
https://docs.microsoft.com/en-us/power-bi/guidance/rls-guidance
Question 40
- (Exam Topic 4)
You have a Power BI report. The report contains visualizations that have interactions. You need to identify which visualizations take the longest to complete. What should you use?
Correct Answer:B
Use Power BI Desktop Performance Analyzer to optimize reports.
In Power BI Desktop you can find out how each of your report elements, such as visuals and DAX formulas, are performing. Using the Performance Analyzer, you can see and record logs that measure how each of your report elements performs when users interact with them, and which aspects of their performance are most (or least) resource intensive.
Reference:
https://docs.microsoft.com/en-us/power-bi/create-reports/desktop-performance-analyzer