Question 31
- (Exam Topic 4)
You have a query that returns the data shown in the following exhibit.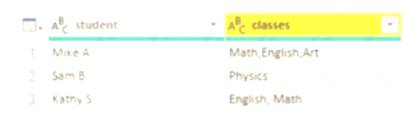
You need to configure the query to display the data as shown in the following exhibit.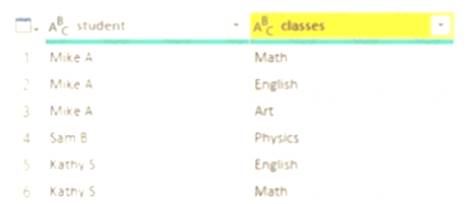
Which step should you use in the query?
Correct Answer:B
Power Query Unpivot columns: You might want to unpivot data, sometimes called flattening the data, to put it in a matrix format so that all similar values are in one column. This is necessary, for example, to create a chart or a report.
Chart Description automatically generated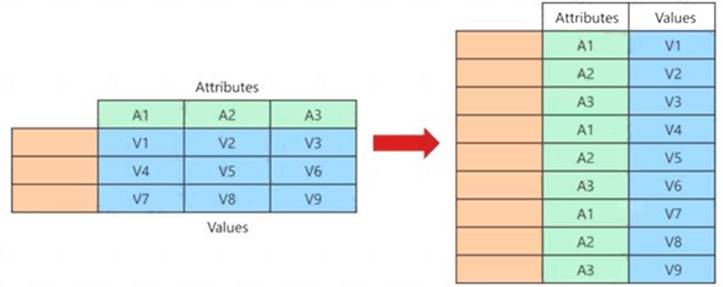
Note:
Syntax: Table.Unpivot(table as table, pivotColumns as list, attributeColumn as text, valueColumn as text) as table
Table.Unpivot translates a set of columns in a table into attribute-value pairs, combined with the rest of the values in each row.
Reference:
https://docs.microsoft.com/en-us/power-query/unpivot-column https://docs.microsoft.com/en-us/powerquery-m/table-unpivot
Question 32
- (Exam Topic 4)
You need to create a measure that will return the percentage of late orders.
How should you complete the DAX expression? To answer, select the appropriate options in the answer area. NOTE: Each correct selection is worth one point.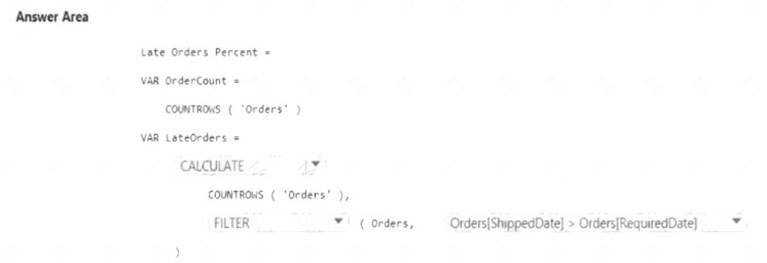
Solution:
.
Graphical user interface Description automatically generated
Does this meet the goal?
Correct Answer:A
Question 33
- (Exam Topic 4)
You use an R visual to produce a map of 500,000 customers. You include the values of CustomerID, Latitude, and Longitude in the fields sent to the visual. Each customer ID is unique.
In powerbi.com, when users load the visual, they only see some of the customers. What is the cause of the issue?
Correct Answer:D
R visuals in the Power BI service have a few limitations including: Data size limitations – data used by the R visual for plotting is limited to 150,000 rows. If more than 150,000 rows are selected, only the top 150,000 rows are used and a message is displayed on the image. Additionally, the input data has a limit of 250 MB.
Reference:
https://docs.microsoft.com/en-us/power-bi/visuals/service-r-visuals
Question 34
- (Exam Topic 4)
You have the line chart shown in the exhibit. (Click the Exhibit tab.)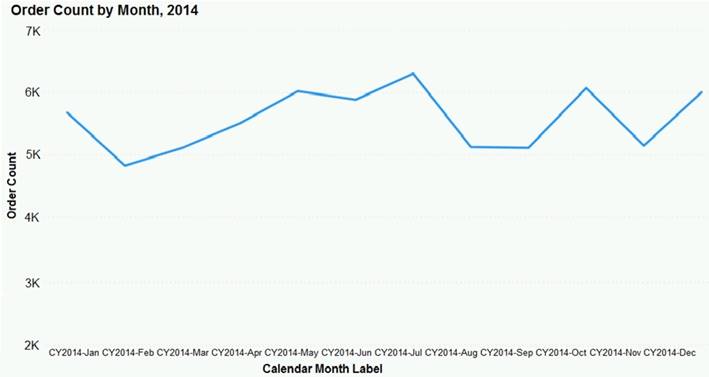
You need to modify the chart to meet the following requirements:  Identify months that have order counts above the mean. Display the mean monthly order count.
Which three actions should you perform in sequence? To answer, move the appropriate actions from the list of actions to the answer area and arrange them in the correct order.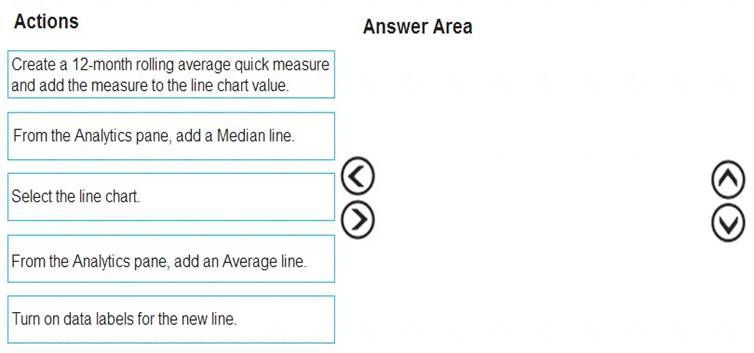
Solution: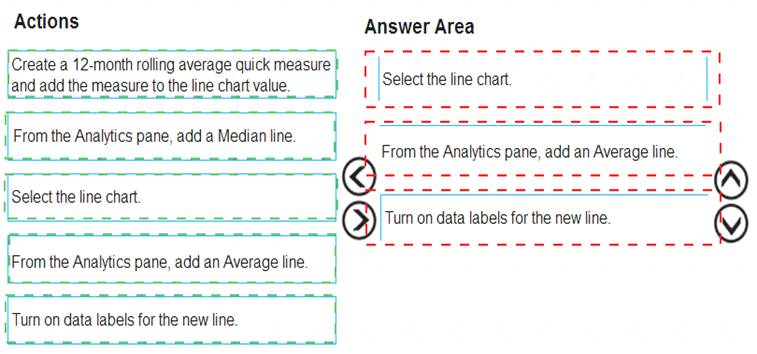
Does this meet the goal?
Correct Answer:A
Question 35
- (Exam Topic 4)
Your company has employees in 10 states.
The company recently decided to associate each state to one of the following three regions: East, West, and North.
You have a data model that contains employee information by state. The model does NOT include region
information.
You have a report that shows the employees by state.
You need to view the employees by region as quickly as possible. What should you do?
Correct Answer:B
https://www.mssqltips.com/sqlservertip/4720/binning-and-grouping-data-with-power-bi/
Question 36
- (Exam Topic 4)
You have a data model that contains many complex DAX expressions. The expressions contain frequent
references to the RELATED and RELATEDTABLE functions.
You need to recommend a solution to minimize the use of the RELATED and RELATEDTABLE functions. What should you recommend?
Correct Answer:A
Combining data means connecting to two or more data sources, shaping them as needed, then consolidating them into a useful query.
When you have one or more columns that you’d like to add to another query, you merge the queries. Note: The RELATEDTABLE function is a shortcut for CALCULATETABLE function with no logical
expression.
CALCULATETABLE evaluates a table expression in a modified filter context and returns A table of values. Reference:
https://docs.microsoft.com/en-us/power-bi/connect-data/desktop-shape-and-combine-data