Question 19
- (Exam Topic 2)
You need to grant access to the business unit analysts.
What should you configure? To answer, select the appropriate options in the answer area. NOTE: Each correct selection is worth one point.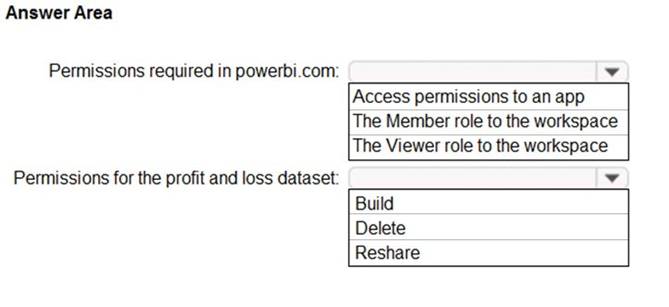
Solution:
Box 1: The Viewer role to the workspace
The Viewer role gives a read-only experience to its users. They can view dashboards, reports, or workbooks in the workspace, but can’t browse the datasets or dataflows. Use the Viewer role wherever you would previously use a classic workspace set to “Members can only view Power BI content”.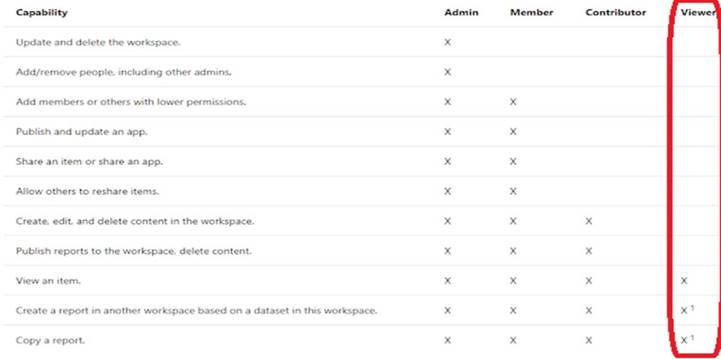
Box 2: Build
The analysts must be able to build new reports from the dataset that contains the profit and loss data. Scenario: The reports must be made available to the board from powerbi.com.
The analysts responsible for each business unit must see all the data the board sees, except the profit and loss data, which must be restricted to only their business unit's data. The analysts must be able to build new reports from the dataset that contains the profit and loss data, but any reports that the analysts build must not be included in the quarterly reports for the board. The analysts must not be able to share the quarterly reports with anyone.
Reference:
https://www.nickyvv.com/2019/08/the-new-power-bi-workspace-viewer-role-explained.html
Does this meet the goal?
Correct Answer:A
Question 20
- (Exam Topic 3)
You need to create the On-Time Shipping report. The report must include a visualization that shows the percentage of late orders.
Which type of visualization should you create?
Correct Answer:A
Scenario: The On-Time Shipping report will show the following metrics for a selected shipping month or quarter:
The percentage of orders that were shipped late by country and shipping region Customers that had multiple late shipments during the last quarter
Note: Bar and column charts are some of the most widely used visualization charts in Power BI. They can be used for one or multiple categories. Both these chart types represent data with rectangular bars, where the size of the bar is proportional to the magnitude of data values.
The difference between the two is that if the rectangles are stacked horizontally, it is called a bar chart. If the rectangles are vertically aligned, it is called a column chart.
Reference:
https://www.pluralsight.com/guides/bar-and-column-charts-in-power-bi
Question 21
- (Exam Topic 4)
You have the data lineage shown in the following exhibit.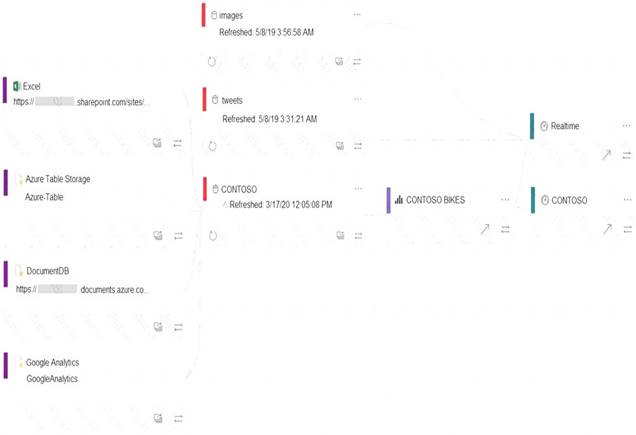
Use the drop-down menus to select the answer choice that completes each statement based on the information presented in the graphic.
NOTE: Each correct selection is worth one point.
Solution:
Text, table Description automatically generated with medium confidence
Box 1: CONTOSO BIKES report Box 2: three datasets
Images, tweets and the Contoso datasets.
Does this meet the goal?
Correct Answer:A
Question 22
- (Exam Topic 4)
You open a query in Power Query Editor.
You need to identify the percentage of empty values in each column as quickly as possible. Which Data Preview option should you select?
Correct Answer:D
Column quality: In this section, we can easily see valid, Error and Empty percentage of data values associated with the Selected table.
Note: In Power Query Editor, Under View tab in Data Preview Section we can see the following data profiling functionalities: Column quality Column distribution Column profile
Reference:
https://community.powerbi.com/t5/Community-Blog/Data-Profiling-in-Power-BI-Power-BI-Update-April-2019/
Question 23
- (Exam Topic 4)
Your company plans to completely separate development and production assets such as datasets, reports, and dashboards in Microsoft Power BI.
You need to recommend an application lifecycle strategy. The solution must minimize access to production assets and prevent end users from viewing the development assets.
What should you recommend?
Correct Answer:C
Use different work stages (Development, Test, and Production). Deploy from the Development workspace.
Reference:
https://visualbi.com/blogs/microsoft/powerbi/application-lifecycle-management-power-bi/
Question 24
- (Exam Topic 4)
You are reviewing a query that produces 10,000 rows in the Power Query Editor. You need to identify whether a column contains only unique values.
Which two Data Preview options can you use? Each correct answer presents a complete solution.
NOTE: Each correct selection is worth one point.
Correct Answer:AB
B: Column distribution: This feature provides a set of visuals underneath the names of the columns that showcase the frequency and distribution of the values in each of the columns. The data in these visualizations is sorted in descending order from the value with the highest frequency.
By hovering over the distribution data in any of the columns, you get information about the overall data in the column (with distinct count and unique values).
A: Column profile: This feature provides a more in-depth look at the data in a column [compared to column distribution]. Apart from the column distribution chart, it contains a column statistics chart.
Reference:
https://docs.microsoft.com/en-us/power-query/data-profiling-tools