Question 13
- (Exam Topic 4)
In Power Bi Desktop, you are creating visualizations in a report based on an imported dataset
You need to allow Power Bi users to export the summarized data used to create the visualizations but prevent the users from exporting the underlying data
What should you do?
Correct Answer:B
Question 14
- (Exam Topic 4)
You are modeling data in table named SalesDetail by using Microsoft Power Bl.
You need to provide end users with access to the summary statistics about the SalesDetail data. The users require insights on the completeness of the data and the value distributions.
Which three actions should you perform in sequence? To answer, move the appropriate actions from the list of actions to the answer area and arrange them in the correct order.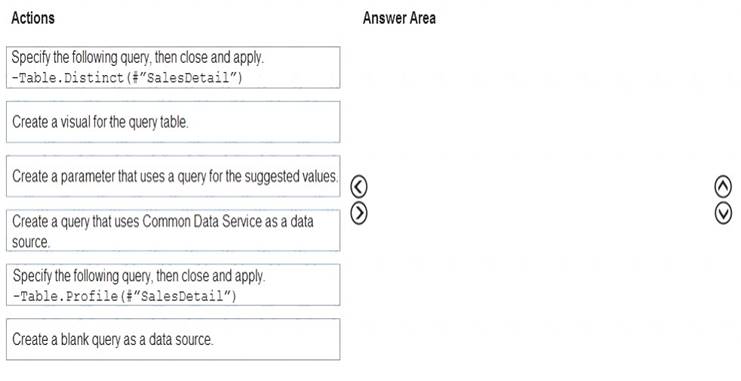
Solution: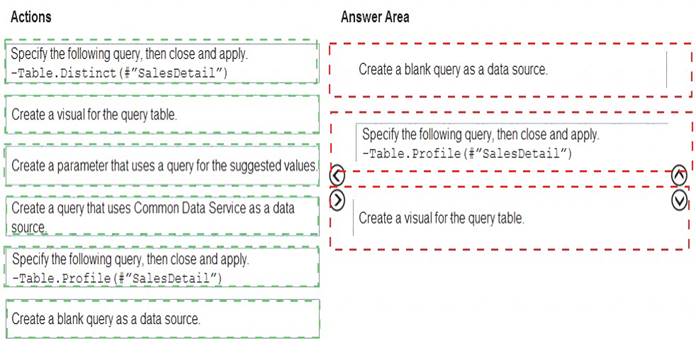
Does this meet the goal?
Correct Answer:A
Question 15
- (Exam Topic 4)
You are preparing a financial report in Power BI.
You connect to the data stored in a Microsoft Excel spreadsheet by using Power Query Editor as shown in the following exhibit.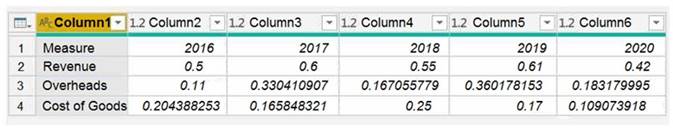
You need to prepare the data to support the following: Visualizations that include all measures in the data over time Year-over-year calculations for all the measures
Which four actions should you perform in sequence? To answer, move the appropriate actions from the list of actions to the answer area and arrange them in the correct order.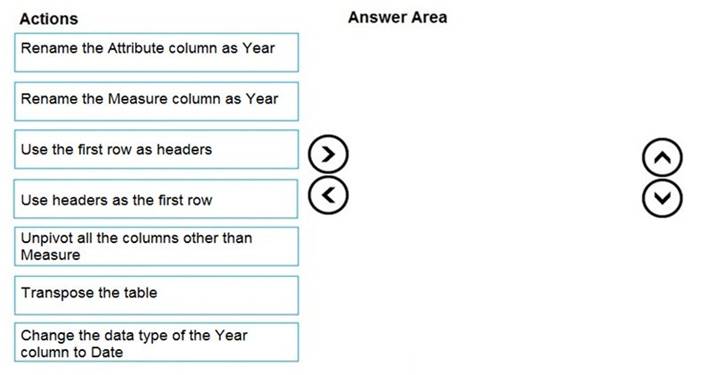
Solution:
Reference:
https://support.microsoft.com/en-us/office/unpivot-columns-power-query-0f7bad4b-9ea1-49c1-9d95-f588221c7
Does this meet the goal?
Correct Answer:A
Question 16
- (Exam Topic 4)
Note: This question is part of a series of questions that present the same scenario. Each question in the series contains a unique solution that might meet the stated goals. Some question sets might have more than one correct solution, while others might not have a correct solution.
After you answer a question in this section, you will NOT be able to return to it. As a result, these questions will not appear in the review screen.
You create a parameter named DataSourceExcel that holds the file name and location of a Microsoft Excel data source.
You need to update the query to reference the parameter instead of multiple hard-coded copies of the location within each query definition.
Solution: You modify the source step of the queries to use DataSourceExcel as the file path. Does this meet the goal?
Correct Answer:A
Parameterising a Data Source could be used in many different use cases. From connecting to different data sources defined in Query Parameters to load different combinations of columns.
Reference:
https://www.biinsight.com/power-bi-desktop-query-parameters-part-1/
Question 17
- (Exam Topic 3)
Correct Answer:A - (Exam Topic 4)
Correct Answer:A
You need to create a measure that will return the percentage of late orders.
How should you complete the DAX expression? To answer, select the appropriate options in the answer area.
NOTE: Each correct selection is worth one point.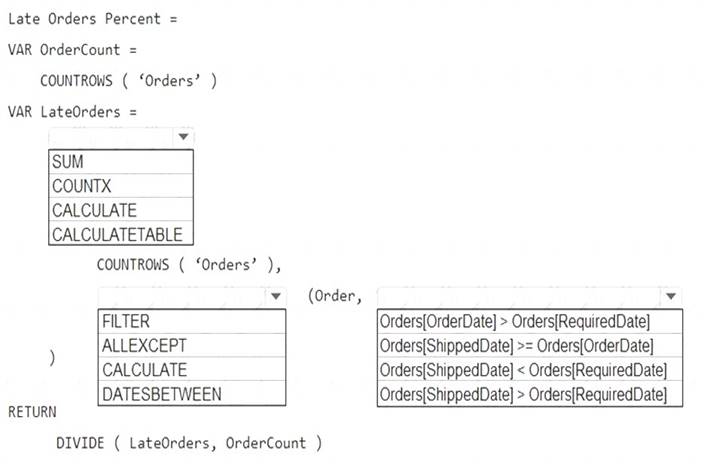
Solution:
Graphical user interface, application Description automatically generated
Box 1: CALCULATE
CALCULATE evaluates an expression in a modified filter context. Syntax: CALCULATE(
filter1, filter2,… (Optional) Boolean expressions or table expressions that defines filters, or filter modifier functions.
Box 2: FILTER
FILTER returns a table that represents a subset of another table or expression. Syntax: FILTER(,
Table- The table to be filtered. The table can also be an expression that results in a table.
Filter - A Boolean expression that is to be evaluated for each row of the table. For example, [Amount] > 0 or [Region] = "France"
Box 3: Orders[ShippedDate]> Orders[RequiredDate]
Northwind Traders defines late orders as those shipped after the required shipping date. Reference:
https://docs.microsoft.com/en-us/dax/calculate-function-dax https://docs.microsoft.com/en-us/dax/filter-function-dax
Does this meet the goal?
Question 18
You build a report to help the sales team understand its performance and the drivers of sales. The team needs to have a single visualization to identify which factors affect success. Which type of visualization should you use?
The key influencers visual helps you understand the factors that drive a metric you're interested in. It analyzes your data, ranks the factors that matter, and displays them as key influencers.
The key influencers visual is a great choice if you want to:  See which factors affect the metric being analyzed. Contrast the relative importance of these factors. For example, do short-term contracts have more impact on churn than long-term contracts?
Reference:
https://docs.microsoft.com/en-us/power-bi/visuals/power-bi-visualization-influencers