Online DA-100 Practice TestMore Microsoft Products >
Free Microsoft DA-100 Exam Dumps Questions
Microsoft DA-100: Analyzing Data with Microsoft Power BI
- Get instant access to DA-100 practice exam questions
- Get ready to pass the Analyzing Data with Microsoft Power BI exam right now using our Microsoft DA-100 exam package, which includes Microsoft DA-100 practice test plus an Microsoft DA-100 Exam Simulator.
- The best online DA-100 exam study material and preparation tool is here.
Question 1
- (Exam Topic 4)
You have five sales regions. Each region is assigned a single salesperson.
You have an imported dataset that has a dynamic row-level security (RLS) role named Sales. The Sales role filters sales transaction data by salesperson.
Salespeople must see only the data from their region.
You publish the dataset to powerbi.com, set RLS role membership, and distribute the dataset and related reports to the salespeople.
A salesperson reports that she believes she should see more data. You need to verify what data the salesperson currently sees. What should you do?
Correct Answer:B
Validate the roles within Power BI Desktop After you've created your roles, test the results of the roles within Power BI Desktop.From the Modeling tab, select View as.
A picture containing application Description automatically generatedThe View as roles window appears, where you see the roles you've created.Graphical user interface, text, application Description automatically
generated Select a role you created, and then select OK to apply that role.The report renders the data relevant for that role.
 You can also select Other user and supply a given user.Graphical user interface, application Description automatically generated Select OK.The report renders based on what that user can see.
Reference:
https://docs.microsoft.com/en-us/power-bi/admin/service-admin-rls
Question 2
- (Exam Topic 4)
You have a CSV file that contains user complaints. The file contains a column named Logged. Logged contains the date and time each compliant occurred. The data in Logged is in the following format:
at 08:59.
You need to be able to analyze the complaints by the logged date and use a built-in date hierarchy. D18912E1457D5D1DDCBD40AB3BF70D5D
What should you do?
Correct Answer:C
Question 3
- (Exam Topic 4)
You are building a dataset from a JSON file that contains an array of documents.
You need to import attributes as columns from all the documents in the JSON file. The solution must ensure that date attributes can be used as date hierarchies in Microsoft Power BI reports.
Which three actions should you perform in sequence? To answer, move the appropriate actions from the list of actions to the answer area and arrange them in the correct order.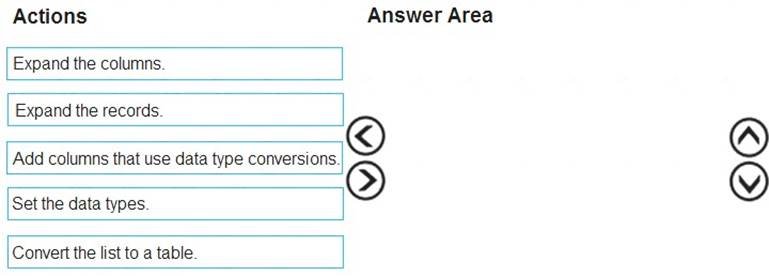
Solution:
Here is an example: https://youtu.be/B4kzyxnhQfI The definition of the function which expand columns:
https://docs.microsoft.com/en-us/powerquery-m/table-expandrecordcolumn
Does this meet the goal?
Correct Answer:A
Question 4
- (Exam Topic 4)
You import a large dataset to Power Query Editor.
You need to identify whether a column contains only unique values.
Which two Data Preview options can you use? Each correct answer presents a complete solution. NOTE: Each correct selection is worth one point
Correct Answer:AD
Question 5
- (Exam Topic 1)
You need to create relationships to meet the reporting requirements of the customer service department. What should you create?
Correct Answer:A
Scenario: The customer service department requires a visual that can be filtered by both sales month and ship month independently.
Reference:
https://docs.microsoft.com/en-us/power-bi/transform-model/desktop-relationships-understand
Question 6
- (Exam Topic 4)
Note: This question is part of a series of questions that present the same scenario. Each question in the series contains a unique solution that might meet the stated goals. Some question sets might have more than one correct solution, while others might not have a correct solution.
After you answer a question in this scenario, you will NOT be able to return to it. As a result, these questions will not appear in the review screen.
You have a clustered bar chart that contains a measure named Salary as the value and a field named Employee as the axis. Salary is present in the data as numerical amount representing US dollars.
You need to create a reference line to show which employees are above the median salary. Solution: You create an average line by using the Salary measure.
Does this meet the goal?
Correct Answer:B
Instead create a percentile line by using the Salary measure and set the percentile to 50%.
Note: The 50th percentile is also known as the median or middle value where 50 percent of observations fall below.
Reference:
https://dash-intel.com/powerbi/statistical_functions_percentile.php