Question 13
- (Topic 1)
Find Cp and Cpk.
Correct Answer:D
Question 14
- (Topic 2)
An assembly line has 3 × 3 squares painted behind each person. Signs indicate the parts and quantities that should be placed there. This is an example of:
Correct Answer:B
Question 15
- (Topic 2)
A set of data from a process has 8 readings per sample and 50 samples. The mean of the 50 sample means is 12.62. The mean of the 50 ranges is 0.18.Find control limits for the R chart.
Correct Answer:C
The formula required to calculate control limits for the R chart are as follows: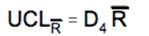
= 1.864 x 0.18 = 0.33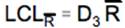
= 0.1111 x 0.18 = 0.02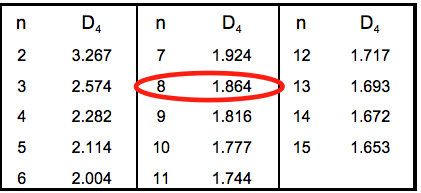
Question 16
- (Topic 2)
A process produced 1394 units. During this time 11 defects were detected. The Rolled Throughput Yield ( RTU) is approximately:
Correct Answer:A
Question 17
- (Topic 1)
Deming called the technique of studying a sample to gain understanding of the distribution of a population an “enumerative study.” His main objection to these studies was:
Correct Answer:C
Question 18
- (Topic 1)
SCENARIO A Six Sigma team is measuring the moisture content of corn starch as it leaves the conveyer belt of a dryer. They collect one sample four cups of starch at times indicated in the chart at fixed locations labeled A, B, C, and D across the end of the belt. See the diagram below.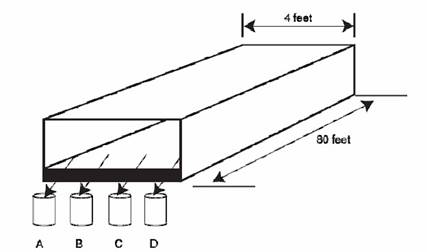
After some work on the dryer, additional data are collected which when plotted looks like this: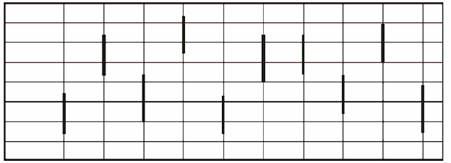
Which type of variation dominates?
Correct Answer:B