Question 13
- (Topic 2)
A small business has recently launched their website and wants to understand how the website is being used. In particular, there is interest in identifying which areas of each page receive the most attention. The analyst has decided to communicate this information by displaying the top pages overlaid with colours denoting the volume of clicks.What type of visualization technique is being used here?
Correct Answer:B
According to the Guide to Business Data Analytics, a heatmap is a type of visualization technique that uses colours to represent the values of a variable across a two- dimensional space. A heatmap can help reveal patterns, trends, and outliers in the data, as well as show the relative importance or intensity of different areas. In this situation, the analyst has decided to communicate the information about the website usage by displaying the top pages overlaid with colours denoting the volume of clicks. This is a heatmap, as it uses colours to show the distribution and magnitude of clicks across the web pages. References:Guide to Business Data Analytics, page 61;CBDA Exam Blueprint, page 7;Heat Maps | Trendz Analytics
Question 14
- (Topic 2)
Interested in ensuring that analytics continues to contribute value to the overall organization, the lead analyst suggests developing a long term plan to define how the enterprise will identify, store, manage, share, and use its data long-term.The analyst is proposing the development of a:
Correct Answer:C
A data strategy is a long-term plan that defines how the enterprise will identify, store, manage, share, and use its data to achieve its business goals and objectives1. A data strategy aligns the data vision, mission, principles, and policies with the business strategy, and guides the data governance, data quality, data architecture, data security, data integration, data analytics, and data culture of the organization2. A data strategy helps the organization to leverage its data as a strategic asset, to create value, to improve performance, and to gain competitive advantage3.
A data roadmap is a document that outlines the specific actions, milestones, deliverables, and timelines for implementing the data strategy. A data roadmap is a tactical tool that helps the organization to prioritize, coordinate, and communicate its data initiatives, and to track its progress and outcomes. A data roadmap is not a long-term plan, but a dynamic and flexible plan that can be updated and revised as the data strategy evolves.
A business strategy is a high-level plan that defines how the enterprise will achieve its vision, mission, and goals in a competitive market. A business strategy sets the direction, scope, and value proposition of the organization, and guides its decisions on resource allocation, product development, customer segmentation, pricing, marketing, and differentiation. A business strategy is not a plan that defines how the enterprise will identify, store, manage, share, and use its data, but a plan that defines how the enterprise will create and sustain value for its stakeholders.
A data management plan is a document that describes the data that will be collected, generated, or used in a specific project, and how the data will be handled, stored, preserved, shared, and reused during and after the project. A data management plan is a operational tool that helps the project team to comply with the data policies, standards, and best practices of the organization, and to ensure the quality, integrity, security, and accessibility of the data. A data management plan is not a long-term plan, but a project- specific plan that can be modified and updated as the project progresses.
References:1: Guide to Business Data Analytics, IIBA, 2020, p. 392: Introduction to Business Data Analytics: An Organizational View, IIBA, 2019, p. 143: Data Strategy: The Definitive Guide, Tableau, . : Data Strategy: The Definitive Guide, Tableau, . : Data Roadmap: The Definitive Guide, Tableau, . : Business Strategy: The Definitive Guide, Tableau, . : Business Strategy: The Definitive Guide, Tableau, . : Data Management Plan: The Definitive Guide, Tableau, . : Data Management Plan: The Definitive Guide, Tableau, .
: Data Strategy: The Definitive Guide, Tableau, . : Guide to Business Data Analytics, IIBA, 2020, p. 39. : Introduction to Business Data Analytics: An Organizational View, IIBA, 2019, p. 14. : Data Strategy: The Definitive Guide, Tableau, . : Data Roadmap: The Definitive Guide, Tableau, . : Business Strategy: The Definitive Guide, Tableau, . : Data Management Plan: The Definitive Guide, Tableau, .
Question 15
- (Topic 2)
Which attribute in the Customerissues entity would be categorized as unstructured data?
•CustomerlD
•ConcernCategory
•ConcernSubCategory
•AgentID
•ComplaintNotes
•lssueResolved(Y/N)
Correct Answer:A
Unstructured data is data that does not have a predefined format, structure, or schema, and that cannot be easily stored, processed, or analyzed by traditional databases or tools1. Unstructured data may include text, images, audio, video, or other types of data that are rich in information but complex and diverse in nature2. In the Customerissues entity, the ComplaintNotes attribute would be categorized as unstructured data, as it may contain free-form text that captures the details, sentiments, or emotions of the customers?? complaints, and that may vary in length, language, tone, or style. The ComplaintNotes attribute would require special techniques, such as natural language processing, text mining, or sentiment analysis, to extract meaningful insights from the unstructured data3.
The other attributes in the Customerissues entity would be categorized as structured data, as they have a predefined format, structure, or schema, and that can be easily stored, processed, or analyzed by traditional databases or tools4. Structured data may include numbers, dates, codes, categories, or other types of data that are simple and consistent in nature5. In the Customerissues entity, the CustomerlD, ConcernCategory, ConcernSubCategory, AgentID, and lssueResolved(Y/N) attributes would be categorized as structured data, as they may contain numeric, alphanumeric, or binary values that represent the identifiers, classifications, or statuses of the customers?? issues, and that may have fixed lengths, ranges, or domains.
References:1: Guide to Business Data Analytics, IIBA, 2020, p. 412: Introduction to Business Data Analytics: A Practitioner View, IIBA, 2019, p. 83: Data Analysis: The Definitive Guide, Tableau, 4: Guide to Business Data Analytics, IIBA, 2020, p. 415: Introduction to Business Data Analytics: A Practitioner View, IIBA, 2019, p. 8. : Data Analysis: The Definitive Guide, Tableau, . : Guide to Business Data Analytics, IIBA, 2020, p. 41. : Introduction to Business Data Analytics: A Practitioner View, IIBA, 2019, p. 8.
Question 16
- (Topic 1)
A government agency is conducting a study on the performance of 12th grade students' in mathematics across the country. In particular, they want to understand if there is a relationship between intelligence and scores, as well as the difference in performance between various locations. Which combination of inferential statistics procedures should be used?
Correct Answer:C
A correlation co-efficient is a measure of the strength and direction of the linear relationship between two variables, such as intelligence and scores. A correlation co-efficient can range from -1 to 1, where -1 indicates a perfect negative relationship, 0 indicates no relationship, and 1 indicates a perfect positive relationship12. An analysis of variance (ANOVA) is a procedure that tests whether the means of two or more groups are significantly different from each other, such as the performance of students across various locations. ANOVA can compare the variation within eachgroup and the variation between groups to determine if there is a statistically significant difference among the group means34. References: 1: Guide to Business Data Analytics, IIBA, 2020, p. 582: Statistics for Business and Economics, David R. Anderson et al., 2014, p. 7133: Guide to Business Data Analytics, IIBA, 2020, p. 594: Statistics for Business and Economics, David R. Anderson et al., 2014, p. 849.
Question 17
- (Topic 1)
The team has completed their analysis on a vast amount of collected data and agree on their recommendations for action.
However, they are having difficulty in developing the appropriate messages to support their recommendations. The business analysis professional suggests which technique to assist the team?
Correct Answer:D
Storyboarding is a technique that helps the team to develop the appropriate messages to support their recommendations by creating a visual sequence of the main points, evidence, and actions. Storyboarding helps the team to organize their thoughts, identify gaps, and communicate their findings in a clear and compelling way12 References: 1: Developing Key Messages for EffectiveCommunication - MSKTC 2: 11 Ways Highly Successful Leaders Support Their Team - Redbooth
Question 18
- (Topic 2)
An analyst is doing a clinical study on the value of analyte among a large population of healthy people. The analyst is going to use a Gaussian Distribution to share the results. Which of the following represents a Gaussian Distribution? (IMAGE TAKEN)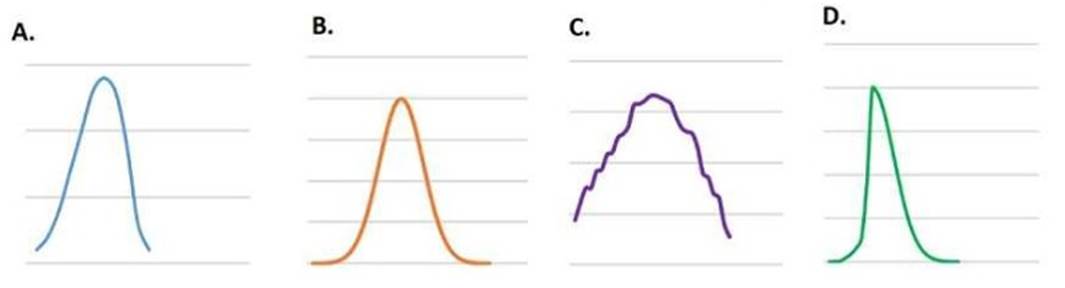
Correct Answer:C
As explained in the previous question, a Gaussian Distribution, also known as a normal distribution, is represented by a symmetrical bell-shaped curve. The mean, median, and mode of the distribution are equal and are at the center of the distribution. This type of distribution is characterized by its mean and standard deviation. The curve is symmetrical around the mean. In the image, the curve labeled A is the only one that matches this description. The other curves are either skewed or irregular.
References: Guide to Business Data Analytics, page 58-59; CBDA Exam Blueprint, page 7; [Introduction to Business Data Analytics: A Practitioner View], page 17.